macro / ch 10
10.3Exploring the relationship between unemployment and inflation
Short-run Phillips curve (HL only)
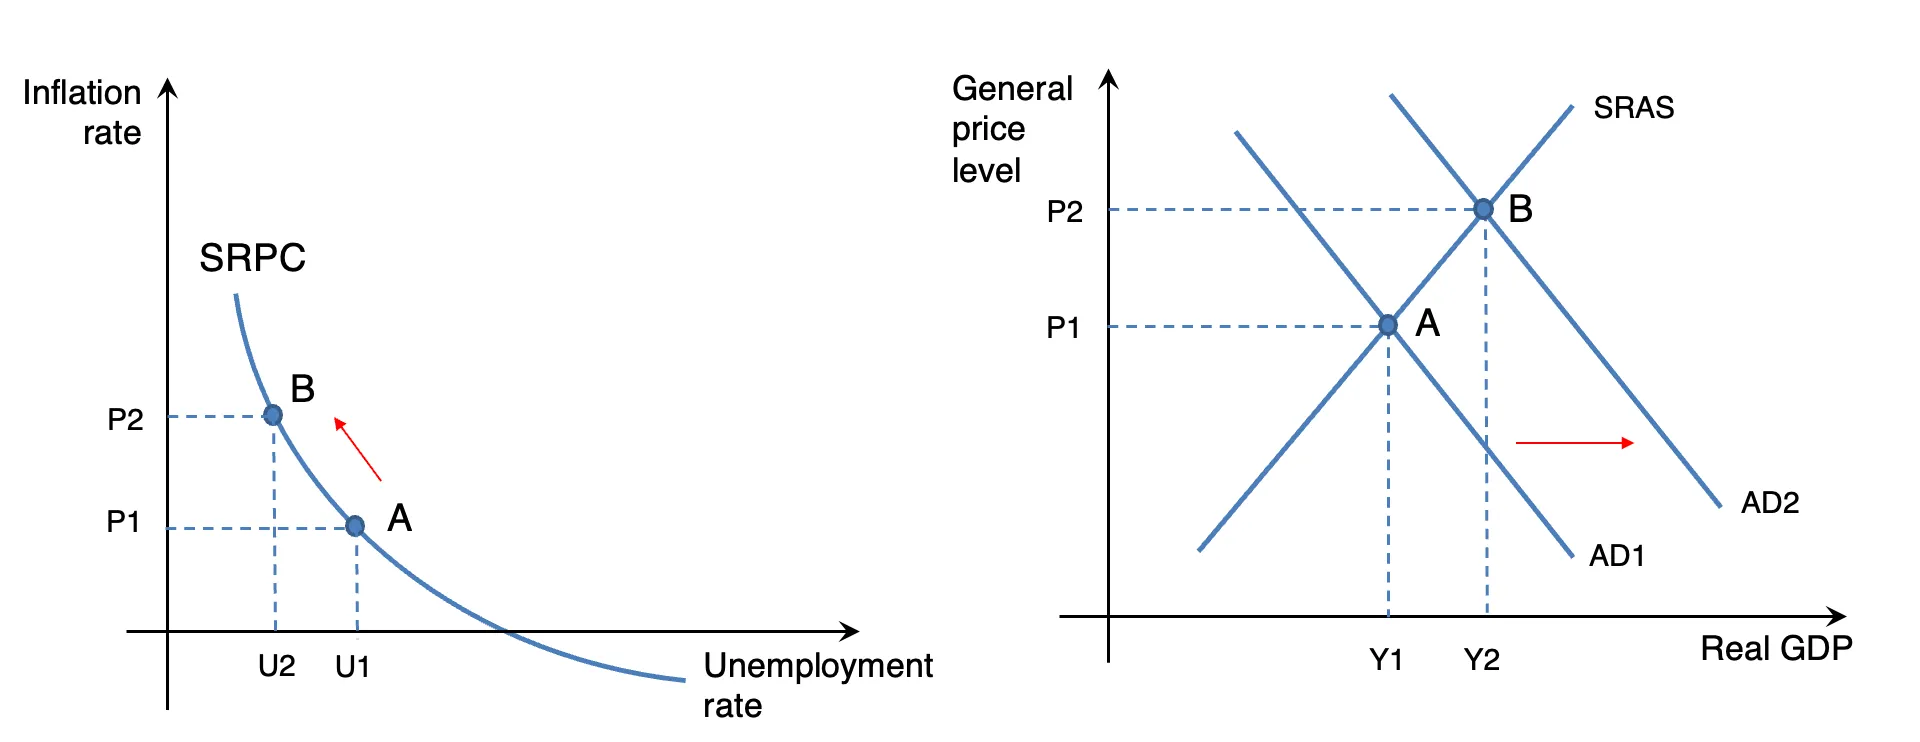
- The short-run Phillips curve shows the potential trade-off between unemployment and inflation.
- An outward shift in AD in an AD/AS diagram is illustrated by an upward movement along the short run Phillips curve (SRPC).
-
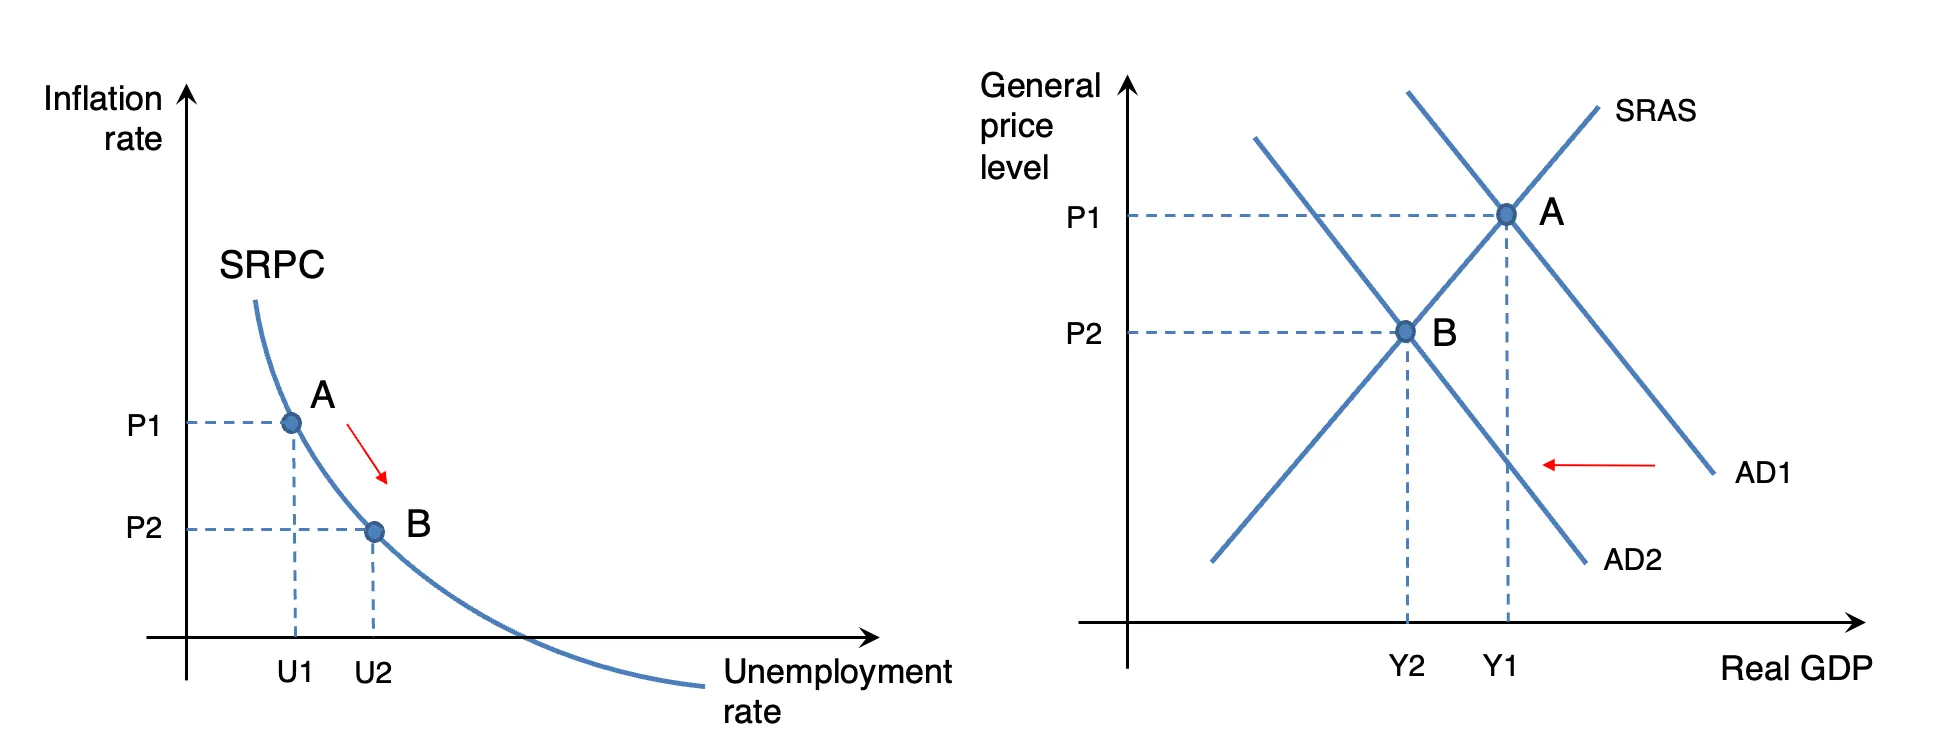
- An inward shift in AD in an AD/AS diagram is illustrated by a downward movement along the SRPC
-
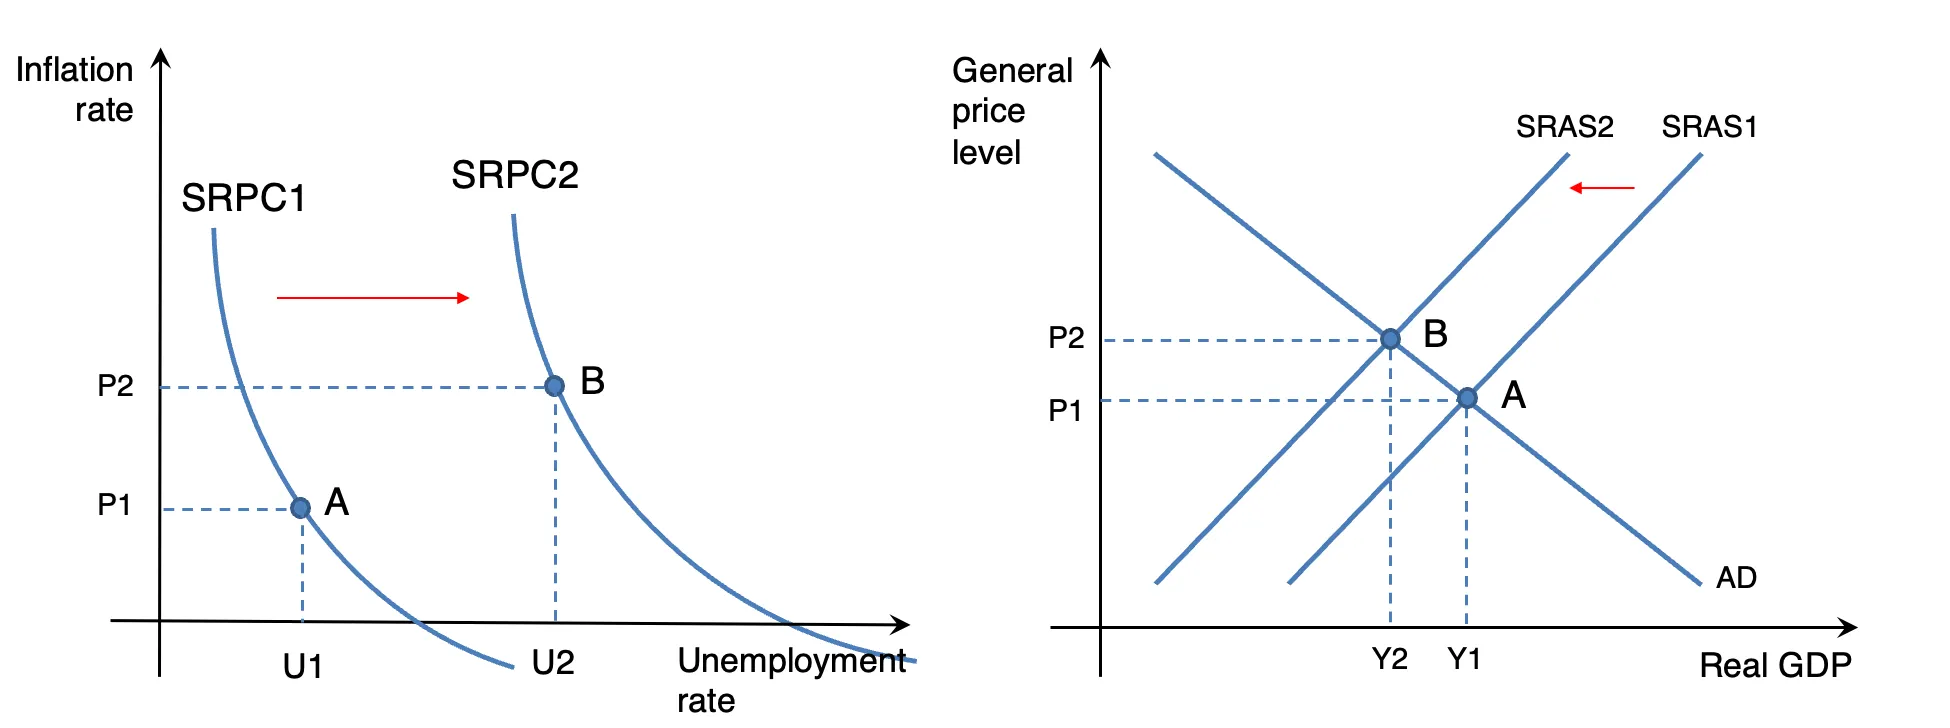
- Cost-push inflation or stagflation is illustrated by an outward shift of the SRPC
-
Long run Phillips curve (HL only)
- According to the New Classical school of thought, unemployment will always revert to the natural rate of unemployment in the long term due to flexible resource costs.
-
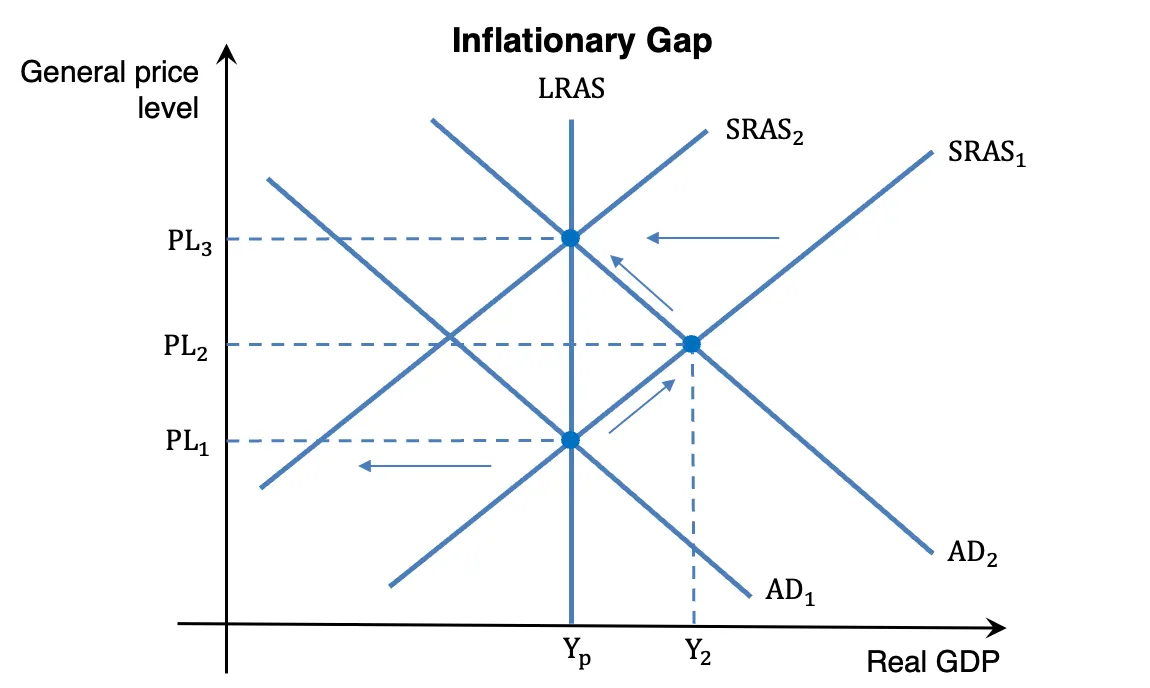
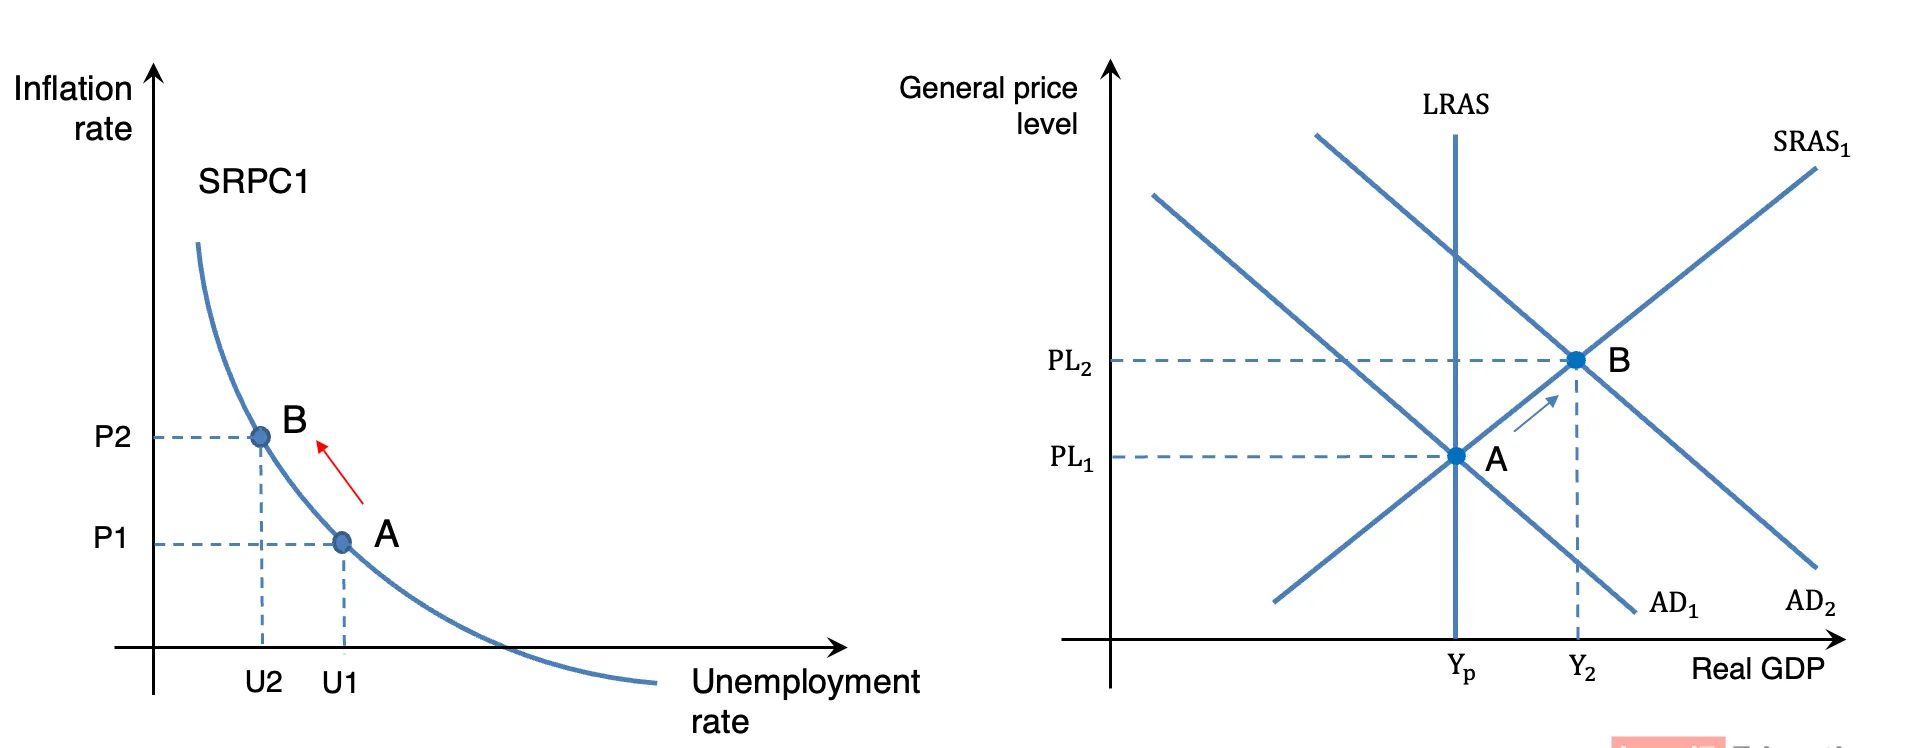
- Assume there is an outward shift in AD, resulting in higher inflation and reduced unemployment, this causes an upward movement along the SRPC from A to B.
-
- As resources costs adjust to a higher price level, SRAS decreases to SRAS2, resulting in further inflation but also higher unemployment. This causes an outward shift of the SRPC curve.
-
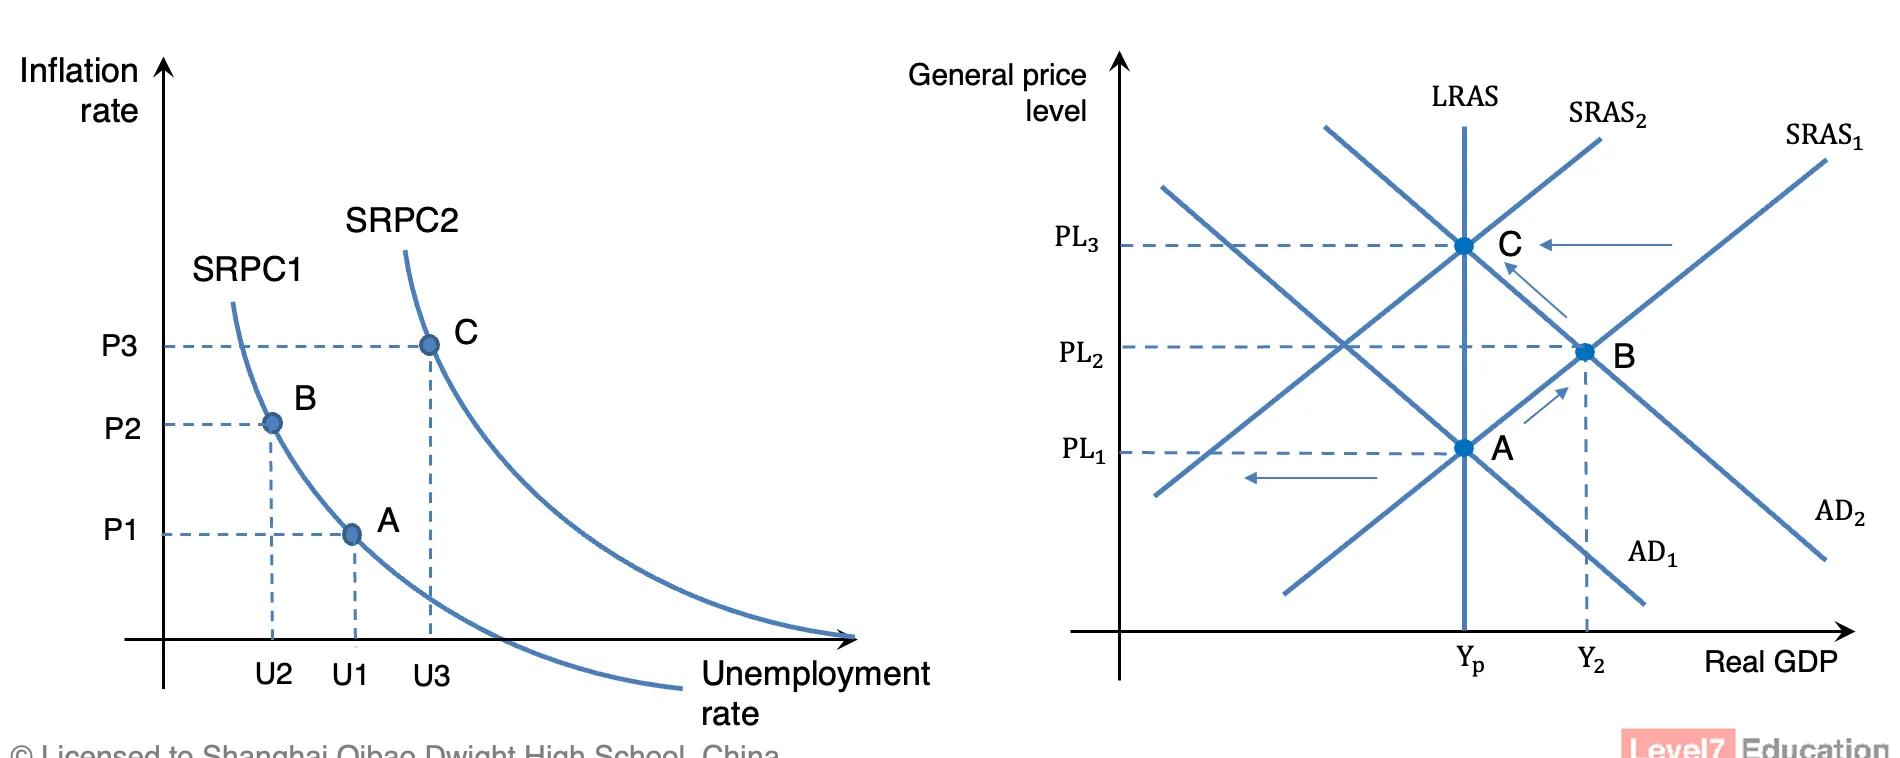
- Ultimately, according to New Classical assumptions, any inflationary gaps will be eliminated in the long run and unemployment will always revert to the natural rate of unemployment.
- Hence, in the long run there is no trade-off between inflation and unemployment. This is represented by a vertical long run Phillips curve as the natural rate of unemployment, which correlates to the full employment level of output in the New Classical AD/AS model.
-
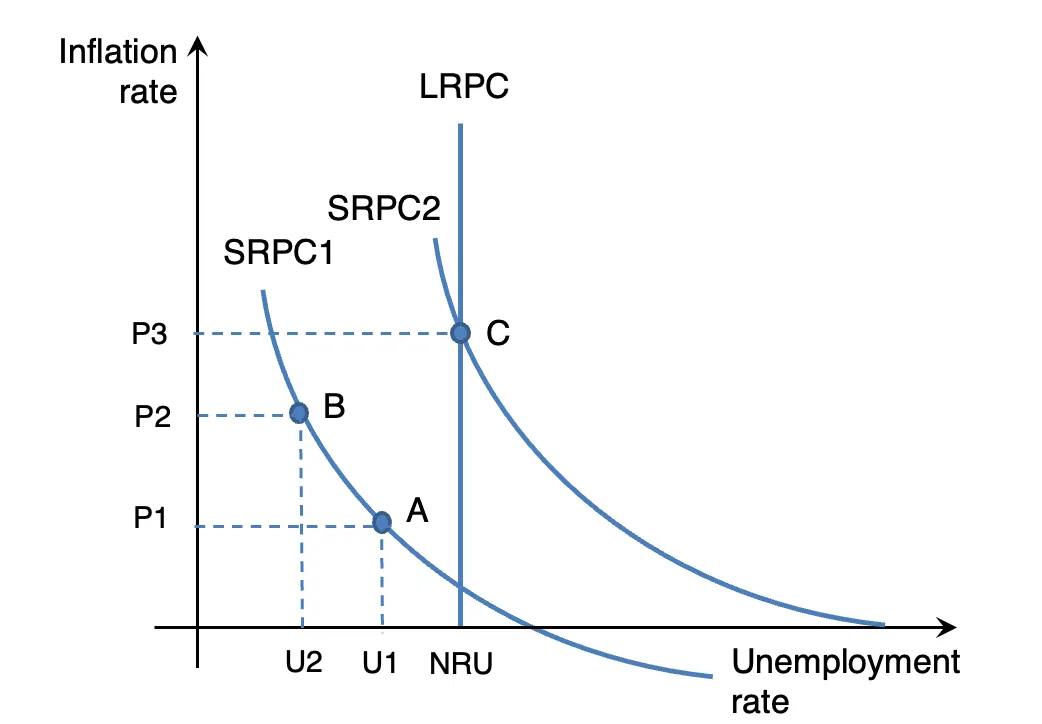
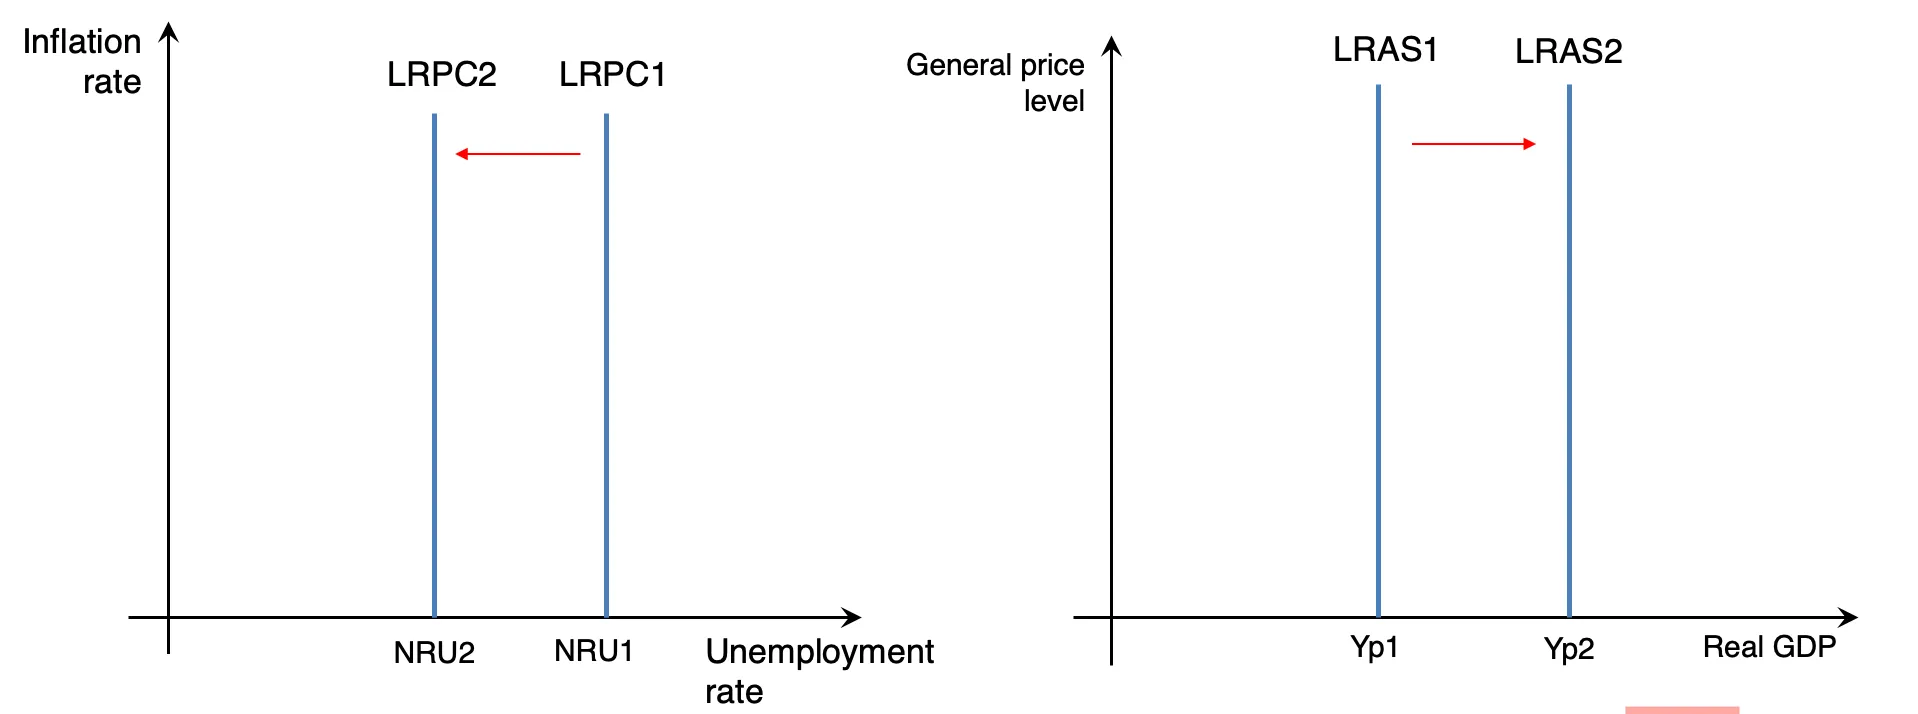
- Supply side policies which reduce the natural rate of unemployment can shift the LRAS curve and LRPC respectively.
-